DECEMBER UPDATE
December 2018 sales in the Powell River residential real estate market were 22 which is down from 27 in November. Similarly, new listings were at 19, down from 28 in November. Both numbers are pretty typical for this time of year. Overall sales for 2018 were at 401, down from 504 in 2017. The market has slowed, however, the interesting news is that with the change, we are still in a seller’s market which speaks of high demand and low inventory. Powell River is still an attractive place to buy. Even with price drops in the bigger markets, our prices are still pretty affordable and our city has lots to offer. Through this past year, the number of days homes are on the market before selling is lower than last year, which by our standards was a very competitive market. This speaks of continued strong demand. Overall this year, homes have sold at 98% of the list price. It’s a good time to sell your home in Powell River! As we move into spring, we should see an nice bump in the homes available which is good news for buyers as well. Call me for the latest market advice.

2018 BY THE NUMBERS
- 401 Total residential sales (down from 504 in 2017)
 15 Percent increase in average selling price of single family homes in all areas over last year
- 40 Building lots sold (54% decrease over last year)
- 14 Percent decrease in average selling price of building lots in all areas over last year
- 4 Sales to ‘foreign’ buyers (2.1% of total residential sales from ‘out of country’)
- 189 Sales to buyers from outside Powell River (46.8% – up from 47.6% in 2017)
- 101 Sellers who moved away from Powell River (up from 74 in 2017)
- 59 Buyers retired to Powell River (down 0.4% from 2017)
- 9 Buyers who retired and stayed in Powell River (downsized?)
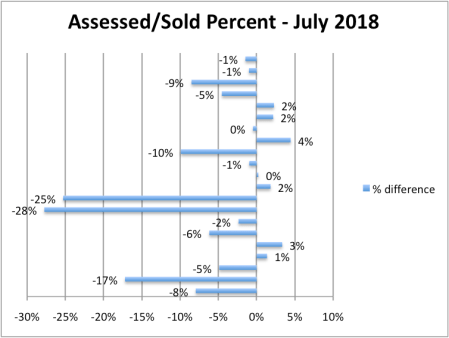
TAX ASSESSMENTS
More under than over? Tax assessments on our homes for the 2019 year are taken as of July 2018. In other words, the assessment should be a snapshot of the value of your home on July 31, 2018. Your property taxes for 2019 will be based on this value. Annually, I take a sample of home sales in Powell River and compare the sale price (market value) with the assessed value. This year there were 21 sales in July. For privacy reasons, I have not included the addresses. The graph shows the percentage difference between the sale price and assessed price. (Negative values mean the assessment is lower than the sale price.) As you can see, in this sample the assessed values tend to be below market value. You can also see that the differences vary widely. The new bcassessments.ca site has been updated and allows you to check the assessed value for any property in BC if you have the address. If you think your assessment is too high, call me. I’m happy to give you a free market evaluation which may be helpful if you plan to challenge your tax assessment. Take note: the deadline is January 31 to indicate that you will be disputing the assessment.